  Rank: Advanced Member Groups: Registered
Joined: 30/03/2011(UTC)
Posts: 393
Was thanked: 132 time(s) in 113 post(s)
|
|
 1 user thanked kilele for this useful post.
|
|
|
|
  Rank: Administration Groups: Registered, Advanced Member Joined: 23/06/2009(UTC) Posts: 1,740   Was thanked: 318 time(s) in 268 post(s)
|
Hello Ioan, Try to define the first function this way θ.gISO(t):20+345*eval(log10(8*t+1))You will note a drastically reducing of computation time. I do not know the answer why eval() on logarithms work much faster. Actually, without eval() you sametimes will not get the answer at all. Again, I do not know why. Then try to put some trace() commands and see the output window. For instance, try to put trace(Δθ.acier) below its calculation. In your green region, all the values are numerical up to the end of for loop. In your function regions after few iterations it becomes a long symbolical value and then function are going crazy. Again, I do not know why  . If you put some eval() here and there, the calculation will not be performed. Try to experiment yourself. I think here is some SMath bug as well, and I do not know to explain what is actually happening, sorry See the picture please. The right one (Ok) is giving all the numerical values inside the loop. The left one after some number of iterations (11-th ????) is giving a long symbolical result. The same think will happen if you delete the green region and the function body (blue region) is just the copy of the green one. The loop varaible will reset to 1 after 7,8,9 (this time to 11-th) iterations after the huge result of Δθ.acier appear??? I can not explain this. 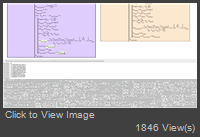 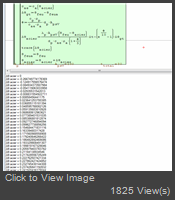 Regards, Radovan Edited by user 12 June 2013 09:47:11(UTC)
| Reason: Not specified |
When Sisyphus climbed to the top of a hill, they said: "Wrong boulder!" |
1 user thanked omorr for this useful post.
|
|
|
|
Rank: Administration Groups: Registered, Advanced Member Joined: 23/06/2009(UTC) Posts: 1,740 Was thanked: 318 time(s) in 268 post(s)
|
I was tired last night tracing variables and giant expression, and this morning figured out to put eval() - and the problem was solved (let's say that). See attached. I have no idea what has going on. Unfortunately, this is once more the presentation of quite unreliable calculation of SMath engine. If this had happened in my class, I would not have any reasonable explanation of what happened. To be honest, I become tired of "chasing ghosts" in this way By all means, this peculiar behavior of SMath must have been fixed. I've just played with Screencast-O-Matic like kilele  Here it is on my 64bit computer eval() or not to eval()Regards, Radovan Edited by user 12 June 2013 10:57:13(UTC)
| Reason: Not specified File Attachment(s): omorr attached the following image(s): |
When Sisyphus climbed to the top of a hill, they said: "Wrong boulder!" |
1 user thanked omorr for this useful post.
|
|
|
|
Rank: Administration Groups: Registered, Advanced Member Joined: 23/06/2009(UTC) Posts: 1,740 Was thanked: 318 time(s) in 268 post(s)
|
You are welcome Ioan The "catch 22" here is that you must use eval() to solve things like this one. Moreover, I do not know where the "winning place" is and why. It is just "a hunch" or a trial and error procedure - quite frustrating sometimes. However, if you use eval() you will break the things afterwards. Some calculations will simply refuse to work with it (like root finding, nonlinear solvers, etc.) Regards, Radovan Edited by user 12 June 2013 11:16:28(UTC)
| Reason: Not specified |
When Sisyphus climbed to the top of a hill, they said: "Wrong boulder!" |
1 user thanked omorr for this useful post.
|
|
|
|
Rank: Advanced Member Groups: Registered
Joined: 30/03/2011(UTC)
Posts: 393
Was thanked: 132 time(s) in 113 post(s)
|
@ioan92
If it's any help, I've just put my laptop specifications into the signature. Just guessing I think it's something related to drivers:
I have this problem all the time when opening samples from other users, however in this very same computer I tried a few Linux distros with different results, for example on SolusOS, SMath worksheets are apparently displayed just like they were created; however on other distros the problem remains or even it is worse.
I reckon that Andrey is aware of this problem and he does not know how to adress it yet. I know that odd sh** happens all the time in computers but maybe he can design an extra layer to avoid these visualization problems, something to reorder/fit/adjust regions according to user alignments/resolution/monitor/font sizes.. maybe something that automatically checks relative relations between blocks.. if that's not possible there could be a preview visualization of the worksheet in extreme conditions of resolutions,etc..or even a preset of templates to reorder all regions fittig such conditions.
|
1 user thanked kilele for this useful post.
|
|
|
|
Forum Jump
You cannot post new topics in this forum.
You cannot reply to topics in this forum.
You cannot delete your posts in this forum.
You cannot edit your posts in this forum.
You cannot create polls in this forum.
You cannot vote in polls in this forum.


