 Rank: Newbie
Groups: Registered
Joined: 28/02/2013(UTC) Posts: 1 
|
Trying to plot the real and imaginary part of a solution in a plot but I am unable to do so. Any help? I do get values for A and B. Both of them are a 10x1 matrix. Values range from 3-5 for the real part. 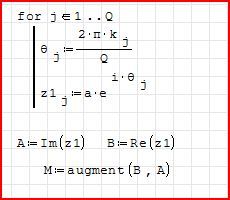 
|
|
|
|
|
|
 Rank: Advanced Member Groups: Registered
Joined: 15/04/2012(UTC) Posts: 1,990  Was thanked: 1128 time(s) in 724 post(s)
|
I can just guess what the example was supposed to do as you do not specify the vector k. mkraska attached the following image(s): |
|
|
|
|
|
|
Forum Jump
You cannot post new topics in this forum.
You cannot reply to topics in this forum.
You cannot delete your posts in this forum.
You cannot edit your posts in this forum.
You cannot create polls in this forum.
You cannot vote in polls in this forum.


